
Research & field stories
Housing vacancy rates by state range from 6.5% in Connecticut to 19.5% in Maine, according to the 2025 American Community Survey. Maine has the highest rate and Connecticut the lowest. Most high rates reflect seasonal and vacation homes, not empty or abandoned houses. The national rate is 9.6%.
As of 2027, the latest state-level Census data still comes from the 2025 American Community Survey (ACS). It shows Maine with the highest share of vacant housing at 19.5%, followed by Vermont at 17.5% and Alaska at 15.6%. Connecticut has the lowest rate at 6.5%, with Illinois (6.7%) and New Jersey (6.9%) next. The national rate is 9.6%.
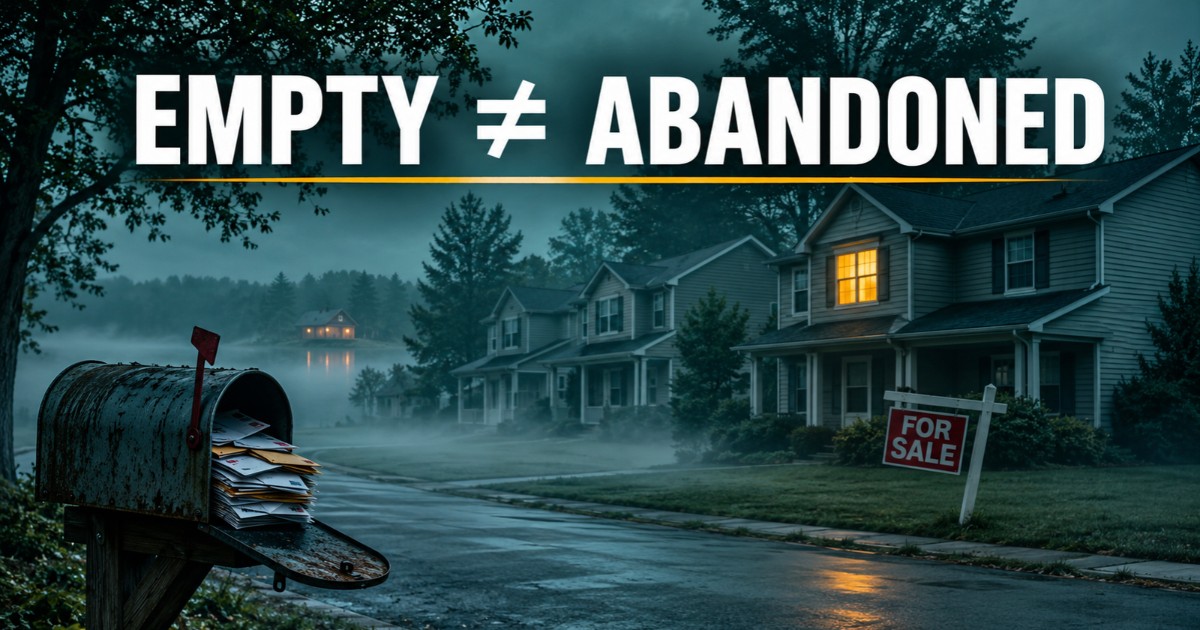
Before reading those numbers as a sign of decay, it helps to know what “vacant” means to the Census Bureau. It covers any housing unit where nobody is living when the survey is taken: a lake cabin in February, an apartment between tenants, a house under contract, a home being renovated. Most of Maine’s vacant housing falls into the seasonal group. An empty cabin is vacant on paper. It is not abandoned.
This guide shows the highest and lowest states, explains how the rental and homeowner rates differ from the overall rate, and covers what you can and can’t conclude from any of them.
Quick answers
- Highest overall vacancy rate: Maine, 19.5% (2025 ACS 1-year estimate).
- Lowest overall vacancy rate: Connecticut, 6.5%.
- Highest rental vacancy rate (Census HVS, 2025 annual): Louisiana, 11.1%. The lowest was Maine, 2.2%. The national rate was 7.1%.
- Latest national numbers (Q3 2026): 7.6% for rentals and 1.2% for owner-occupied housing.
- Is vacant the same as abandoned? No. Abandonment is a physical and legal condition that the vacancy statistic doesn’t measure.
What do housing vacancy rates by state measure?
Housing vacancy rates by state measure the share of housing units in each state that are vacant. A vacancy rate is the share of housing units in some group that are vacant. The catch is that the Census Bureau publishes several versions, and they answer different questions.
The overall vacancy rate comes from the ACS. It counts every vacant unit, including seasonal homes, as a share of all housing units. This is the one behind the “highest and lowest states” rankings below.
The rental vacancy rate comes from the Housing Vacancy Survey (HVS). It measures units that are vacant and for rent as a share of the rental stock. The ACS also publishes its own version.
The homeowner vacancy rate measures owner-occupied-type units that are vacant and for sale as a share of the owner stock.
The HVS also publishes gross vacancy (all vacant units, seasonal included) and year-round vacancy (seasonal units left out). When you see a vacancy figure, check which of these it is before comparing it to anything.
States with the highest vacancy rates
These are the top 10 states by share of housing units that were vacant in 2025, from the ACS 1-year estimates.
| Rank | State | Vacant housing units |
|---|---|---|
| 1 | Maine | 19.5% |
| 2 | Vermont | 17.5% |
| 3 | Alaska | 15.6% |
| 4 | West Virginia | 14.2% |
| 5 (tie) | Alabama | 13.9% |
| 5 (tie) | Louisiana | 13.9% |
| 7 | Florida | 13.6% |
| 8 | New Hampshire | 13.3% |
| 9 | Hawaii | 12.8% |
| 10 | Delaware | 12.7% |
The top of the list is mostly vacation country. In Maine, about 76% of vacant units were held for seasonal, recreational, or occasional use in 2022, according to a HUD market analysis of the state. Only Vermont had a higher share. A LendingTree analysis of 2020–2024 ACS data found that 75.8% of Vermont’s vacant homes are seasonal or recreational, which works out to about 14.7% of all the state’s housing units sitting empty in the off-season.
Not every high-vacancy state fits that pattern. West Virginia, Alabama, and Louisiana have little tourism-driven housing, so their numbers reflect other things, such as older housing stock, slow population growth, and units that are for rent or held off the market.
States with the lowest vacancy rates
Here are the 10 states with the lowest overall vacancy rates in 2025.
| Rank from lowest | State | Vacant housing units |
|---|---|---|
| 1 | Connecticut | 6.5% |
| 2 | Illinois | 6.7% |
| 3 | New Jersey | 6.9% |
| 4 (tie) | Maryland | 7.1% |
| 4 (tie) | Nebraska | 7.1% |
| 6 | California | 7.3% |
| 7 | Washington | 7.5% |
| 8 (tie) | Iowa | 7.6% |
| 8 (tie) | Ohio | 7.6% |
| 8 (tie) | Utah | 7.6% |
Maine’s rate is about three times Connecticut’s. Keep in mind that ACS numbers are survey estimates with margins of error, so states that sit a tenth of a point apart can’t be reliably ranked against each other. The gap between the top and bottom of the list is real. The order within the middle of it is not.
A low rate means a smaller share of homes are classified as vacant. It doesn’t tell you whether housing is affordable, whether enough homes are for sale, or whether any particular block has a problem. A low rate can just as easily signal a tight, expensive market.
Why do seasonal homes distort housing vacancy rates by state?
Across the country, roughly 14.5 million homes are vacant, and LendingTree’s breakdown of ACS data puts about 4.7 million of them in the seasonal or recreational group, 2.6 million for rent, and fewer than 800,000 for sale. According to USAFacts, seasonal units made up at least half the vacant housing stock in more than one-fifth of U.S. counties as of the 2020 Census.
That’s why a state full of well-kept second homes can top a vacancy ranking while having very little housing for sale or rent to a year-round resident. If anything, the opposite is often true. Maine’s housing is tight for people who live there, and that brings us to the rental numbers.
What are the rental housing vacancy rates by state?
If you care about apartments and rentals, use a rental vacancy rate. The Census Bureau’s Housing Vacancies and Homeownership annual statistics include a state table for it.
In the 2025 annual data, the national rental vacancy rate was 7.1%. Louisiana had the highest state estimate at 11.1%, and Maine had the lowest at 2.2%. Those are point estimates from a sample survey. Louisiana’s margin of error is roughly 1.5 points and Maine’s is roughly 1.3, and the 2025 annual figures are built from 11 months of data because October 2025 data wasn’t collected during the federal shutdown.
The result is the most useful contrast in this article: Maine has the highest overall vacancy rate in the country and one of the lowest rental vacancy rates. There is no contradiction. The first number is dominated by seasonal homes. The second counts only units that are actually for rent.
For current context, the Census Bureau’s Q3 2026 release put the national rental vacancy rate at 7.6%, up from 7.1% a year earlier, according to Mortgage Professional America’s summary.
The ACS has its own rental vacancy rate, and it gives a different picture. In the 2025 ACS, Florida had the highest rental vacancy rate at 9.8%, New Hampshire had the lowest at 3.4%, and the national rate was 5.9%. The two surveys use different methods, so don’t mix their numbers in one comparison.
Homeowner vacancy rates
The homeowner vacancy rate is much smaller, because it counts only owner-type units that are vacant and for sale. The HVS put it at 1.2% nationally in Q3 2026. In the 2025 ACS, the highest state rates were Florida and Louisiana at 1.8% each, and the lowest was Rhode Island at 0.2%, against a national rate of 1.1%.
It’s a useful gauge of how much owner housing is sitting on the market. It says nothing about seasonal homes or neglected properties.
What is a healthy housing vacancy rate?
There is no official healthy level for housing vacancy rates by state. The Census Bureau publishes the rates but does not set a target for them.
Housing vacancy rates by state also differ between rentals and owner homes, so compare like with like. A low rate usually means homes are scarce and hard to find, while a very high rate usually points to many seasonal homes or weak demand. Either way, the rate alone does not prove a housing shortage or a wave of abandonment.
High vacancy does not mean high abandonment
Housing vacancy rates by state count vacant units. A vacant unit is a statistical category. An abandoned property is a real-world condition: the owner has stopped maintaining it, paying taxes on it, or claiming it, and it’s usually deteriorating. A home can be vacant for all of these reasons:
- it’s between tenants;
- it’s listed for sale;
- it’s a vacation home;
- it’s occupied only part of the year;
- it’s being renovated;
- the owner is holding it for another reason; or
- it’s genuinely neglected.
Only the last one is abandonment. The ACS’s “other vacant” category is a catch-all for reasons that don’t fit the rest, and it shouldn’t be read as an abandoned-house count. Our guide to abandoned vs. vacant, zombie, and condemned properties explains how each term is used.
What vacancy numbers can and can’t tell you
Vacancy statistics are good at showing how much of a state’s housing stock is empty, how states compare, how much seasonal housing is inflating a number, and where rentals are tight or loose. They can also point you toward the question of why houses get abandoned in places where vacancy is high for non-seasonal reasons.
They can’t tell you how many homes are abandoned or condemned, how many are in foreclosure, whether vacant homes are affordable or available, or whether a neighborhood is declining. Those questions need other data, usually at the property level. If you’re trying to work out whether a specific house is truly abandoned, start with these signs a house is really abandoned.
Rate vs. count: “most vacant homes” has two answers
Housing vacancy rates by state are percentages. People who search for the states with the most vacant homes may mean either of two things.
The highest rate is a percentage question, and Maine wins it at 19.5%.
The largest number is a count question, and big states win it. Maine has roughly 150,000 vacant units. Texas, with a rate of 9.7%, has about 1.25 million. Florida, at 13.6% of nearly 10.8 million units, has roughly 1.5 million, which is more than California’s approximately 1.1 million even though California has more housing overall. These counts are estimates calculated from the ACS totals and rounded.
So a percentage ranking can’t stand in for a ranking of empty houses, and a count ranking mostly reflects state size.
State, county, and city numbers
Housing vacancy rates by state hide local differences. A statewide rate blends resort towns, rural counties, suburbs, and big cities into one number. A state with a modest overall rate can still have counties where a lot of homes sit empty, and the reverse is also true. To research a place, move from state to county to city to neighborhood. When you get to the city level, our rundown of cities with the most abandoned houses is a good next stop.
How to research a house that looks vacant
If you’ve spotted a house that looks empty, treat it as a question rather than a conclusion.
- Record the address and parcel number. The parcel ID makes every later search easier.
- Look up ownership. County assessor and recorder offices show who owns the property and whether it has changed hands.
- Check whether it’s on the market. Many empty-looking homes are listed for sale or rent.
- Search local records. Building permits, code-enforcement cases, and tax records often explain what’s going on.
- Separate appearance from evidence. Tall grass, boarded windows, and piled-up mail justify a closer look, but none of them proves legal abandonment.
- Check the history. Past sales, older aerial imagery, and local news coverage add context.
For a national picture, see abandoned houses in America, and for an estimate of the total, read how many abandoned houses are in the U.S.
The bottom line
In the 2025 ACS, Maine has the highest overall housing vacancy rate at 19.5% and Connecticut the lowest at 6.5%. Those numbers describe vacant housing of every kind, and in the high-vacancy states a large share of it is seasonal. If you’re comparing states, pick the specific measure first. If you’re looking into abandoned properties, treat the state rate as a starting point and move on to ownership records, property condition, and local data. Read housing vacancy rates by state together with the rental and homeowner rates before drawing conclusions.
Frequently asked questions
Which state has the highest housing vacancy rate?
Maine, at 19.5% of housing units in the 2025 ACS 1-year estimates.
Which state has the lowest housing vacancy rate?
Connecticut, at 6.5%, followed by Illinois (6.7%) and New Jersey (6.9%).
What percentage of homes are vacant in the U.S.?
9.6% in the 2025 ACS. State rates range from 6.5% to 19.5%.
Which state has the highest rental vacancy rate?
In the Census HVS 2025 annual estimates, Louisiana at 11.1%. Maine had the lowest at 2.2%. In the ACS’s separate rental measure, Florida was highest at 9.8% and New Hampshire lowest at 3.4%.
What is the national homeowner vacancy rate?
1.2% in the third quarter of 2026, according to the Census HVS.
Why do some states have such high vacancy rates?
Seasonal and recreational homes are the biggest factor in Maine, Vermont, and Alaska. Rental turnover, homes for sale, and units held off the market also count as vacant.
Does a high vacancy rate mean a state has a lot of abandoned houses?
No. The rate includes many kinds of vacancy and isn’t an abandonment count.
What is the difference between gross and year-round vacancy?
Gross vacancy includes seasonal units. Year-round vacancy leaves them out.
Can I use a state vacancy rate to find abandoned houses?
Only as a rough starting point. Confirming that a particular house is abandoned takes property-level records and evidence of long-term neglect.
What are housing vacancy rates by state?
They are the share of housing units in each state that are vacant, usually measured with Census Bureau data.

AbandonedHouse
We explore the history, architecture and context behind America’s overlooked places through research-led storytelling and responsible documentation.
More stories for curious minds

Tax Lien vs Tax Deed States: Full List by State (2027)
Every state has a way to collect unpaid property taxes. Some sell a claim on the house. Others…

Vacant House Maintenance Checklist for Owners
Vacant house maintenance is the regular inspection and upkeep of a house nobody lives in, covering water, plumbing,…